Original data from 65,687 quote requests
Group Transportation Market Reports
How early groups ask, how big they are, which dates they want, and how it differs by occasion and vehicle, drawn from two years of inquiries across our booking network.
Get Your Free Quote
Pickup ZIP, date, headcount, and hours get you one written total with the driver, fuel, taxes, and gratuity included.
What this library is
Chicago Party Bus Fun is part of a national booking network for party buses, limousines, shuttle buses, and motorcoaches. Each request for a quote across that network is stored as a record: the event date, the occasion, the headcount, the vehicle asked for, and the day the request came in. We took the 65,687 non-spam records with 2024 or 2025 event dates and counted the patterns.
The result is 188 statistics across 25 subjects. This page presents the most useful of them by theme. The remainder appear on the matching event guides and fleet pages, where they sit beside the advice they support.
Read this before quoting anything. The figures describe quote requests. They are not completed trips, they are not a count of people, and they are not limited to Chicago. Prices and figures based on the network's internal "closed" status are deliberately left out. The methodology page sets out the counting rules, field completeness, and suppression thresholds in full.
Our booking-network data
Four figures that frame everything else
The typical request is a group of 11 to 20 asking about a Friday or Saturday, usually less than three months ahead, and most often for a birthday.
49%
81%
18%
34%
Source: 65,687 group-transportation inquiry records with 2024–2025 event dates, collected across the national booking network that Chicago Party Bus Fun is part of. These are quote requests — not completed trips, unique customers, or Chicago-only figures. How we measure this
When groups inquire
The planning window is the gap between the day a quote request arrives and the event date. Across the whole dataset it is short: about a quarter of requests came in under two weeks out, and only 18% arrived 90 days or more ahead.
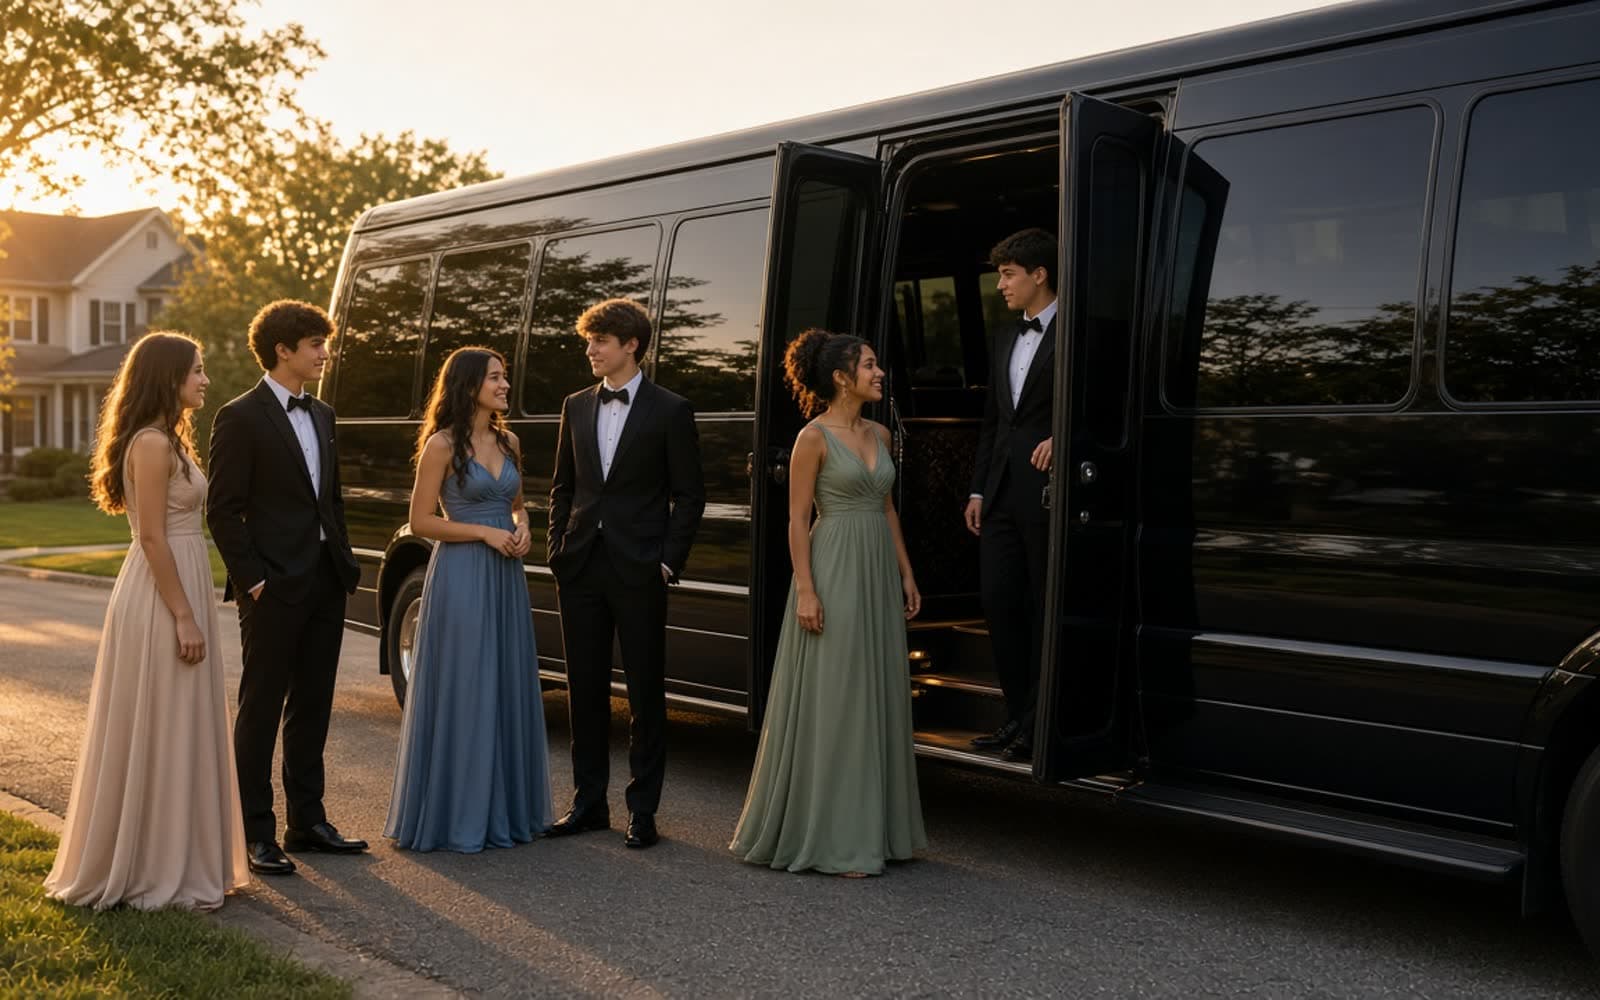
The averages hide large differences. Wedding planners ask far ahead, with 41% at 90 days or more, so anyone arranging wedding transportation for a fall Saturday is competing with people who started months ago. Prom is the reverse: a third of requests land two to four weeks before the dance, which is late for the busiest nights of spring. Our prom party bus guide explains why February is the better time to ask. The largest groups, 56 passengers and up, plan earliest of all, and a 56 passenger coach bus is worth requesting a full season ahead.
| Figure | All-inquiry baseline | What was counted | Records |
|---|---|---|---|
| 23% | — | Across 65,687 non-spam inquiry records for 2024–2025 event dates, 23% were received 14–29 days before the event. | 65,414 |
| 23% | — | Across 65,687 non-spam inquiry records for 2024–2025 event dates, 23% were received 30–59 days before the event. | 65,414 |
| 10% | — | Across 65,687 non-spam inquiry records for 2024–2025 event dates, 10% were received 60–89 days before the event. | 65,414 |
| 18% | — | Across 65,687 non-spam inquiry records for 2024–2025 event dates, 18% were received 90 days to two years before the event. | 65,414 |
| 41% | 18% | Among wedding inquiries for 2024–2025 event dates, 41% were received 90 days to two years before the event; the full-dataset baseline was 18%, a difference of 23 percentage points higher. | 2,854 |
| 33% | 23% | Among prom inquiries for 2024–2025 event dates, 33% were received 14–29 days before the event; the full-dataset baseline was 23%, a difference of 10 percentage points higher. | 1,869 |
| 45% | 18% | Among inquiries for 56–100 passengers for 2024–2025 event dates, 45% were received 90 days to two years before the event; the full-dataset baseline was 18%, a difference of 27 percentage points higher. | 305 |
| 40% | 26% | Among inquiries quoted as limousine for 2024–2025 event dates, 40% were received fewer than 14 days before the event; the full-dataset baseline was 26%, a difference of 14 percentage points higher. | 2,211 |
Group sizes
Passenger count was usable in about 60% of records. Among those, nearly half were groups of 11 to 20, and more than three quarters were 20 or fewer. The 40-seat party that people picture when they hear "party bus" is rare in the requests themselves.
People also tend to ask for a vehicle that matches their headcount. Where both fields were filled in, 85% of 11–20 passenger groups asked for an 11–20 seat vehicle, and 89% of 21–30 passenger groups asked for 21–30 seats. That is sensible, with one caution: a vehicle filled to its last seat feels tight on a long night. If your count is 19 or 20, compare the 20 passenger party bus with the 24 passenger party bus, and use the group size calculator to allow for the guests who confirm late.
| Figure | All-inquiry baseline | What was counted | Records |
|---|---|---|---|
| 28% | — | Across 65,687 non-spam inquiry records for 2024–2025 event dates, 28% of usable passenger counts fell in the 1–10 passengers band. | 39,493 |
| 49% | — | Across 65,687 non-spam inquiry records for 2024–2025 event dates, 49% of usable passenger counts fell in the 11–20 passengers band. | 39,493 |
| 17% | — | Across 65,687 non-spam inquiry records for 2024–2025 event dates, 17% of usable passenger counts fell in the 21–30 passengers band. | 39,493 |
| 4% | — | Across 65,687 non-spam inquiry records for 2024–2025 event dates, 4% of usable passenger counts fell in the 31–40 passengers band. | 39,493 |
| 85% | 54% | Among inquiries for 11–20 passengers for 2024–2025 event dates, 85% of usable vehicle-capacity entries fell in the 11–20-passenger band; the full-dataset baseline was 54%, a difference of 31 percentage points higher. | 7,465 |
| 89% | 23% | Among inquiries for 21–30 passengers for 2024–2025 event dates, 89% of usable vehicle-capacity entries fell in the 21–30-passenger band; the full-dataset baseline was 23%, a difference of 66 percentage points higher. | 2,486 |
| 59% | 18% | Among inquiries for 1–10 passengers for 2024–2025 event dates, 59% of usable vehicle-capacity entries fell in the 1–10-passenger band; the full-dataset baseline was 18%, a difference of 42 percentage points higher. | 4,511 |
Seasons and weekdays
Requested dates cluster hard. Four in five fell on a Friday or Saturday, while Monday and Tuesday together drew about 5%. Spring was the busiest season at 30% of dates, followed by fall and summer; January was the quietest month and October among the fullest.
For a planner the lesson is practical. Vehicles are scarcest, and minimum hours longest, on spring and fall Saturdays. A Sunday brunch run, a Thursday team outing, or a midwinter birthday has far less competition. Groups with a fixed weekend date should ask early; groups with a flexible date should say so in the request, because flexibility is the easiest way to widen the choice of vehicles. Our seasonal guides for winter and summer cover what changes on the road.
| Figure | All-inquiry baseline | What was counted | Records |
|---|---|---|---|
| 30% | — | Across 65,687 non-spam inquiry records for 2024–2025 event dates, 30% of requested event dates fell in spring. | 65,687 |
| 26% | — | Across 65,687 non-spam inquiry records for 2024–2025 event dates, 26% of requested event dates fell in fall. | 65,687 |
| 25% | — | Across 65,687 non-spam inquiry records for 2024–2025 event dates, 25% of requested event dates fell in summer. | 65,687 |
| 81% | — | Across 65,687 non-spam inquiry records for 2024–2025 event dates, 81% of requested event dates fell on Friday or Saturday. | 65,687 |
| 10% | — | Across 65,687 non-spam inquiry records for 2024–2025 event dates, 10% of requested event dates fell in October. | 65,687 |
| 5% | — | Across 65,687 non-spam inquiry records for 2024–2025 event dates, 5% of requested event dates fell in January. | 65,687 |
| 2% | — | Across 65,687 non-spam inquiry records for 2024–2025 event dates, 2% of requested event dates fell on Monday. | 65,687 |
| 3% | — | Across 65,687 non-spam inquiry records for 2024–2025 event dates, 3% of requested event dates fell on Tuesday. | 65,687 |

By event type
Event labels are free text grouped into recognized categories, and only records with a clear label are counted. Birthdays lead at 34% of recognized labels, and they are booked late: more than half of birthday party requests arrived less than 30 days ahead.
Each occasion has its own season. Weddings lean to fall and proms to spring. Bachelor parties and concert trips peak in summer, as do wine tours. Sports requests pile into the fall, with October and November far above the baseline and Sunday dates three times as common as usual, a pattern any Bears game day planner will recognize. Nightlife requests spike in December. Bachelorette planners stand out for foresight: over half asked at least 60 days ahead, which suits a weekend that usually involves flights and hotels too. See the bachelorette party guide for how those weekends are typically built.
| Figure | All-inquiry baseline | What was counted | Records |
|---|---|---|---|
| 34% | — | Across 65,687 non-spam inquiry records for 2024–2025 event dates, 34% of recognized event labels were birthday. | 24,471 |
| 56% | — | Across 8,252 recognized birthday inquiries for 2024–2025 event dates, 56% were received less than 30 days before the event. | 8,235 |
| 45% | 26% | Among wedding inquiries for 2024–2025 event dates, 45% of requested event dates fell in fall; the full-dataset baseline was 26%, a difference of 19 percentage points higher. | 2,864 |
| 74% | 30% | Among prom inquiries for 2024–2025 event dates, 74% of requested event dates fell in spring; the full-dataset baseline was 30%, a difference of 45 percentage points higher. | 1,881 |
| 52% | — | Across clearly labeled bachelorette inquiries for 2024–2025 event dates, 52% were received at least 60 days before the event. | 248 |
| 45% | 25% | Among bachelor party inquiries for 2024–2025 event dates, 45% of requested event dates fell in summer; the full-dataset baseline was 25%, a difference of 20 percentage points higher. | 1,983 |
| 50% | 25% | Among concert inquiries for 2024–2025 event dates, 50% of requested event dates fell in summer; the full-dataset baseline was 25%, a difference of 25 percentage points higher. | 1,126 |
| 58% | 26% | Among sports inquiries for 2024–2025 event dates, 58% of requested event dates fell in fall; the full-dataset baseline was 26%, a difference of 32 percentage points higher. | 971 |
| 23% | 9% | Among nightlife inquiries for 2024–2025 event dates, 23% of requested event dates fell in December; the full-dataset baseline was 9%, a difference of 14 percentage points higher. | 1,228 |
| 40% | 25% | Among wine tour inquiries for 2024–2025 event dates, 40% of requested event dates fell in summer; the full-dataset baseline was 25%, a difference of 15 percentage points higher. | 543 |
| 49% | 11% | Among graduation inquiries for 2024–2025 event dates, 49% of requested event dates fell in May; the full-dataset baseline was 11%, a difference of 38 percentage points higher. | 226 |
By vehicle type
The dataset keeps two vehicle fields apart: what the person asked for, and what was quoted. Both tell the same story about size. Limousine quotes went overwhelmingly to groups of 10 or fewer, and half of Sprinter quotes did too. Party bus requests skewed larger, with 30% for groups of 21 to 30 against a 17% baseline, and nearly every recognizable quote for that group size was a party bus.
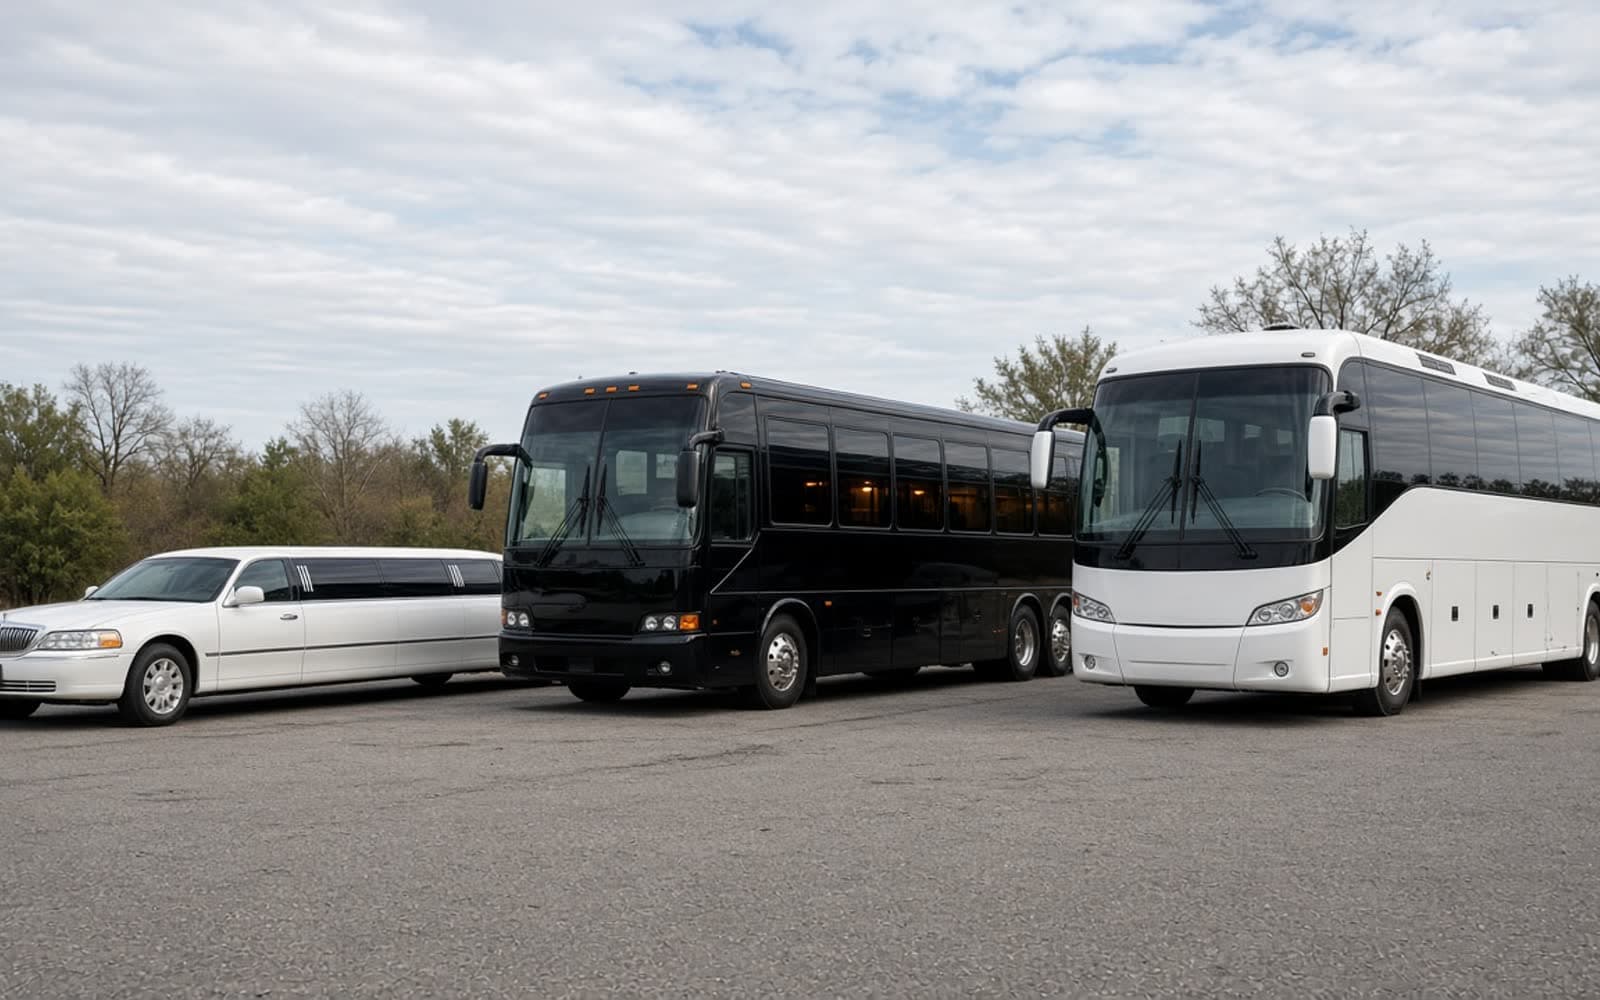
Small vehicles are also requested latest: around 40% of limousine and Sprinter quotes were for events less than two weeks away. If you are choosing between styles, the limousine pages and the 14 passenger limo Sprinter suit groups up to about a dozen, while the party bus range starts to make sense from roughly 15 people. The vehicle comparison tool sets them side by side.
| Figure | All-inquiry baseline | What was counted | Records |
|---|---|---|---|
| 81% | 28% | Among inquiries quoted as limousine for 2024–2025 event dates, 81% of usable passenger counts fell in the 1–10 passengers band; the full-dataset baseline was 28%, a difference of 53 percentage points higher. | 1,820 |
| 40% | 26% | Among inquiries quoted as limousine for 2024–2025 event dates, 40% were received fewer than 14 days before the event; the full-dataset baseline was 26%, a difference of 14 percentage points higher. | 2,211 |
| 50% | 28% | Among inquiries quoted as sprinter for 2024–2025 event dates, 50% of usable passenger counts fell in the 1–10 passengers band; the full-dataset baseline was 28%, a difference of 22 percentage points higher. | 860 |
| 38% | 26% | Among inquiries quoted as sprinter for 2024–2025 event dates, 38% were received fewer than 14 days before the event; the full-dataset baseline was 26%, a difference of 12 percentage points higher. | 992 |
| 30% | 17% | Among inquiries requesting party bus for 2024–2025 event dates, 30% of usable passenger counts fell in the 21–30 passengers band; the full-dataset baseline was 17%, a difference of 14 percentage points higher. | 2,010 |
| 81% | — | Across 11,899 inquiries quoted as party bus for 2024–2025 event dates, 81% of requested event dates fell on Friday or Saturday. | 11,899 |
| 98% | 78% | Among inquiries for 21–30 passengers for 2024–2025 event dates, 98% of recognizable quoted-vehicle entries were categorized as party bus; the full-dataset baseline was 78%, a difference of 20 percentage points higher. | 2,378 |
How to use these figures when you plan
Statistics do not book a bus, but they do tell you what everyone else is doing, and that is what decides availability.
- If your date is a spring or fall Saturday, you are in the most contested slot in the data. Ask as early as you can.
- If your group is 11 to 20, you are the most common request, which means the most choice of vehicles and also the most competition for them.
- If your group is over 30, there are fewer suitable vehicles and the people who need them plan early. Follow their lead.
- If your date can move, say so. A Sunday or a weeknight draws a small fraction of the demand.
When you are ready, the booking page explains what to include in a request and what the written quote will contain. Questions about the data itself can go to the address on our editorial standards page, which also covers corrections.
Turn the data into a plan
Size the group, count back from the date, compare vehicle types, and test a budget.


Booking Experience polls
Add your own data point
Our polls are a separate, informal measure: anonymous votes from visitors to this site. One vote per poll, and nothing personal is stored.
How do you feel about booking accommodations in Seoul that offer cultural experiences?
No votes yet — be first
When booking in London, what amenities do you prioritize?
No votes yet — be first
What is your preferred method of booking accommodations?
No votes yet — be first
Questions about the data
Straight answers for planning a group trip in Chicago
Is this Chicago data?
Do these numbers show how many trips were booked?
Why are there no prices in the reports?
What does the baseline column mean?
Why does the records column change from row to row?
Can I cite these statistics?
How often is the library updated?
What is the live website report further down the page?
See the statistics in context
More vehicles to compare
See all 53 vehicles →




Request a written quote
Tell us about your event and ask for a written quote. If your reservation is serviced by an affiliate or sister company, confirm vehicle, operator, base rate, minimum hours, and included charges with that provider before paying a deposit.